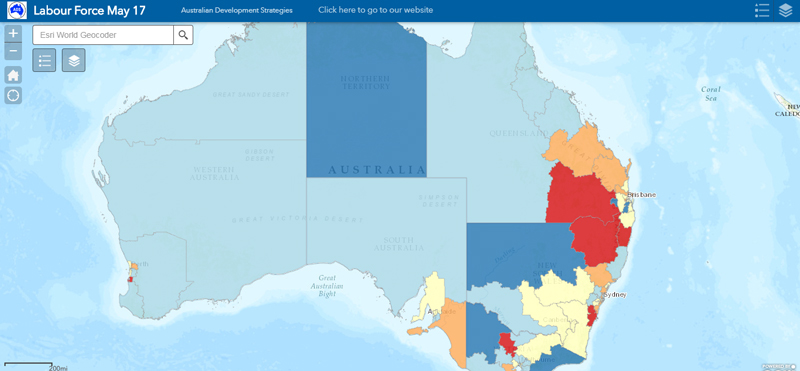
NEW ENGLAND AND BENNELONG BY-ELECTIONS
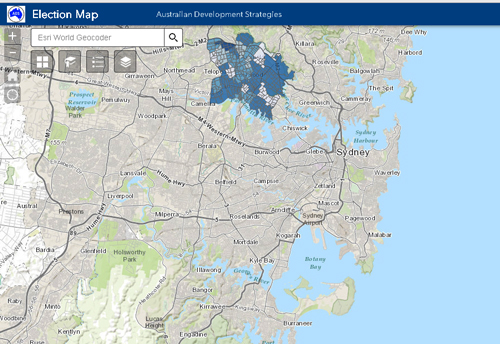
Category:By-Elections,National 2019,NSWSee for yourself in our Esri online map how local demographics fed into the results in New England and Bennelong by-elections and the Same Sex Marriage plebiscite. Click on the link to the map below. It will open with a default map of the Bennelong estimated 2PP swing to the Liberals, with the dark blue