What happened on the weekend to rev up the week ahead.
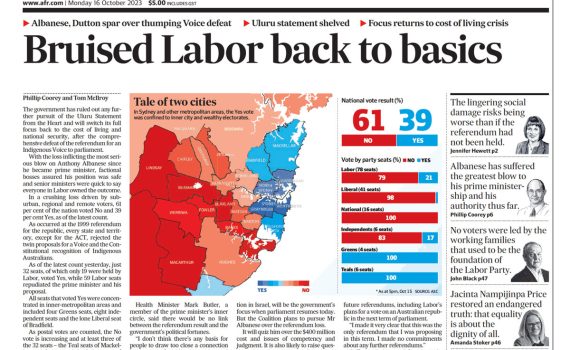
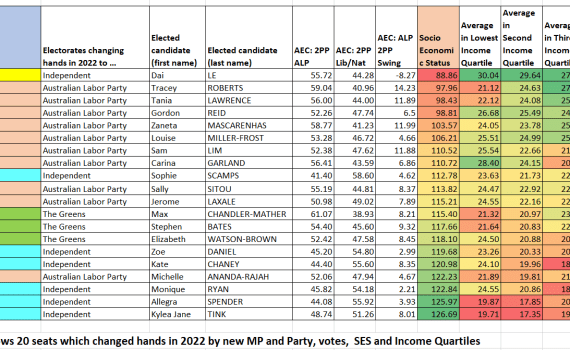
Category:Election Profiles,Election Profiles 2024There’s an hilarious cartoon in the Australian Financial Review today, with a story from me below it. My op ed piece runs through the elections and by-elections we’ve had since the last Federal election on May 21 2022. There’s some good news in there for the Government I think, from the evidence and explanations of