Category Archives: NSW

  • -

Aspirational Left voters rise again in NSW State Election
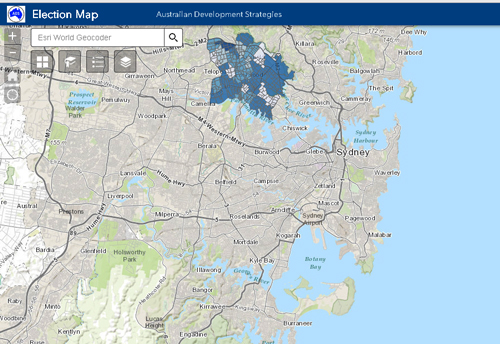
Category:NSW Election 2023

Above is a snip of our ADS/Esri online map showing in shades of red the larger estimated Two Party Preferred swings to Labor in the March 25 NSW election at the close of counting on election night. 🔗 https://arcg.is/0rqGez My preliminary analysis of the March 25 NSW State election vote and swings appears in today’s


  • -
New England and Bennelong By Elections in NSW

NEW ENGLAND AND BENNELONG BY-ELECTIONS

Category:By-Elections,National 2019,NSWTags : 

See for yourself in our Esri online map how local demographics fed into the results in New England and Bennelong by-elections and the Same Sex Marriage plebiscite. Click on the link to the map below. It will open with a default map of the Bennelong estimated 2PP swing to the Liberals, with the dark blue


  • 0

2015 NSW State Election Profile

Category:NSW Election 2015

The current study takes a close look at the demographic characteristics of New South Wales voters who supported Labor or the Coalition in 2015, and who swung to Labor or to the Coalition between 2011 and 2015. We also take our first look at the Greens since 2010. In this report we examine the demographic


  • 0

2011 New South Wales Election Profile

Category:Election Profiles,NSW,NSW Election 2011

We normally look at a chart showing swings to and from political parties by a specific demographic group and it means those above the line swung to Labor and those below the line swung to the Liberals. But for New South Wales last Saturday we frequently found ourselves looking at charts where everybody swung against