Category Archives: National 2019

  • -
Election Analysis - 2019

ELECTION ANALYSIS 2019
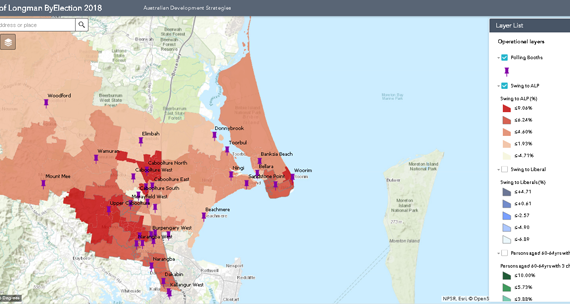
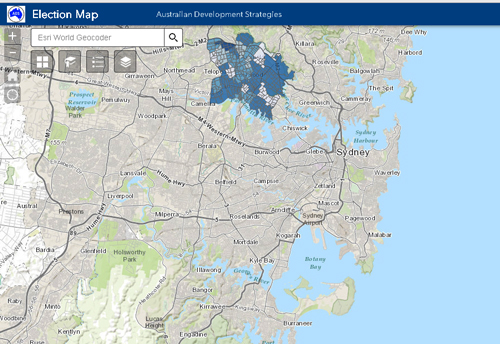
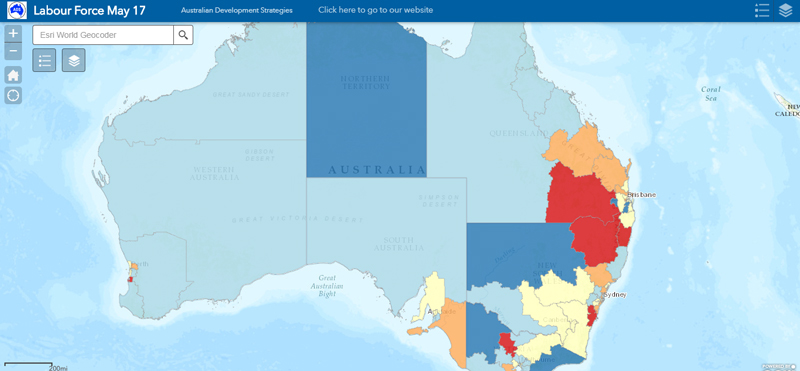
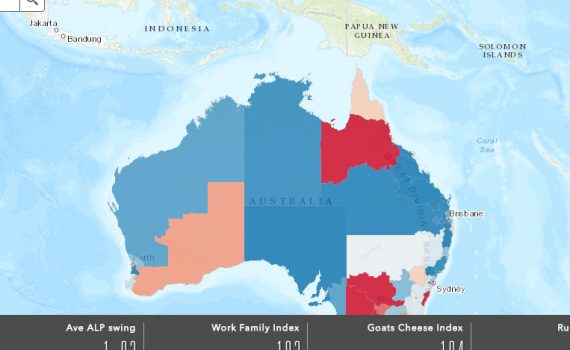
Category:National 2019 Tags : 

Here’s a fantastic Esri map done by Australian Development Strategies and Education Geographics Senior Mapper Dr Jeanine McMullan. It’s online, completely interactive, public and you can email it to your fellow election tragics. You can blow it up, reduce it, drag it around or select an address and see how it rated on each layer. Open it up at the link below, and then click on the little button in the top right corner of the page, to get some tips on how t o use it.

Among the other buttons at top right of the map, there are, from left, layers Layer icon on Esri Map for all the key variables which decided who won the 2019 election, there’s bookmarks Bookmark icon on Esri map for the major regions, so you can go there directly, there’s a score sheet of key indicators Score sheet indicator - Esri map toolbar under every screen being viewed with standardised scores (move the map around and watch the numbers update), there’s the info button Info icon on the Esri Map Toolbar, a share button Share icon on Esri map so you can post the map to social media, a seat button Choose a seat - Icon on Esri Map, so you can check out the scores for each individual seat and finally the legend for each layer displayed. Hours of fun from our mapper.

The link is https://egs-au.maps.arcgis.com/apps/webappviewer/index.html?id=1a84d2f75fe04666a7501c5cd7921c0f


  • -

THE (almost) LAST POST ON LABOR FROM 2019 ELECTION

Category:National 2019 Tags : 

Hi there political tragics. The 2019 election has been fought and finalised and we’re just about finished our preview of the poll and our demographic wrap up.

Based on the research we have read and done ourselves, Labor lost an election it didn’t need to lose, after a campaign in which it offered higher taxes and spending, via an unpopular Leader Bill Shorten.

Labor’s campaign fell flat in working class seats across the outer suburbs and provincial cities across the country. The promises of higher spending failed to resonate with those voters it sought to attract: swinging voters and working families.

The Liberal campaign was led by a boofy suburban Church-going bloke nicknamed ScoMo, who has consistently under-promised and over-delivered in his previous portfolios.

He promised minimal additional spending and tax cuts for business and middle-income earners. This campaign worked a treat with working class and middle-class families, along with Grey voters and active Christians, but the Coalition’s lack of a credible policy on Global Warming cost the Coalition dearly among wealthier, better educated voters inside the Goat Cheese Circle.

With both major party groupings finishing up on between 49 and 51 percent of the vote, either side could have won the 2019 election.

The Coalition won because its rise in support was spread across big numbers of marginal suburban and provincial city seats, whereas the ALP campaign only worked in a smaller number of safe seats in the Goat Cheese Circle and our bigger University suburbs and towns.

That’s all she wrote really.

Here’s a few links for those of you who want more details.

First, here’s a fantastic Esri map done by our Senior Mapper Dr Jeanine McMullan. It’s online and completely interactive. Open it up at this link and click on the little Info icon on the Esri Map Toolbar button in the top right corner of the page, to get some tips on how to use it. You’re welcome to share it around.

The link is https://egs-au.maps.arcgis.com/apps/webappviewer/index.html?id=1a84d2f75fe04666a7501c5cd7921c0f

There’s other links on our web page, including all my original profiling work on Australian historical election records, going back to 1966. https://www.elaborate.net.au/category/election-profiles/

There’s a few blogs already posted under Recent News on the same page.

The one from May 16 on Stereotypes and Voting, previews the election, at https://www.elaborate.net.au/stereotypes-and-voting/

The Religious Rudd and the Grey Voters posted on election day took a look at how these groups looked like moving later that night and turned out be reasonably useful.
https://www.elaborate.net.au/the-religious-rudd-and-the-grey-voters/

After the election there is a May 20 post on the long-term decline in Labor’s vote among working families and its rise among professionals, entitled Shifting Demographic Tectonics. https://www.elaborate.net.au/shifting-demographic-tectonics/

Finally, there’s a story on the decline of the Labor vote among male miners in what used to be its provincial electoral fortresses, see Labor Digs a Hole with Miners. https://www.elaborate.net.au/labour-digs-a-hole-with-miners/


  • -
Labor Digs A Hole With Miners - Federal Election 2019

LABOR DIGS A HOLE WITH MINERS

Category:National 2019 Tags : 

Hello again, political tragics. As we proceed with our 2019 profiling, the longer-term damage Labor has done to itself with working class men just keeps getting uglier.

The chart here tracks the declining profile of miners for the ALP since we first profiled national elections back in 1966.

Labor Digs A Hole With Miners - Federal Election 2019

In 1966 the Labor Party and Labour Movement were the same group in strong mining seats, such as Hunter, held by Labor MPs since 1910.

After male Tradies, male miners were the second most significant driver of the Labor 2PP vote in 1966. The strong mining seat of Hunter recorded a 1966 2PP vote for Labor of 74.4 percent, which was ten percent above the vote predicted by our 1966 model.

So Labor was not only winning the votes from miners, but winning extra votes from mining families, turning mining towns and cities like Newcastle and Broken Hill into Labor fortresses. If you worked in the mines, you were in the union and if you were in the union, you voted Labor and so did your family and your neighbours.

From 1966, the vote for Labor in mining seats began a long-term decline, with the profile for miners falling into negative territory in 1998. By 2019 male miners were as big a negative driver for Labor as they had been a positive driver in 1966. In other words, you were more likely to find miners in Coalition seats than Labor seats and the stats were significant to more than 99.9 percent confidence levels.

In 2019, the three seats with the largest 10 percent plus swings to the Coalition were Dawson, Capricornia and the above seat of Hunter, three of the top eight seats for male miners as a share of the male workforce.

The first two of these mining seats – Dawson and Capricornia – are now held by the Queensland LNP, with Hunter, the former rock-solid Labor seat now reduced to marginal status on 52.5 percent 2PP for Labor.

In fact, of the top eight seats for male miners, all but Hunter now elect non-Labor MPs.

To add insult to injury, when we were modelling the swings to the Coalition across these three mining seats, not only did they record ten percent plus swings to the Coalition, but these swings averaged five percent greater in each seat than the national swing model was predicting.

So miners are voting for the Coalition, so are their families and their neighbours. The model from 1966 has been turned completely on its head.

The mining fortress for Labor among working class men in the mines has fallen. Rebuilding it seems a task too far for the Labor party by 2022, if it remains fixated on fighting back the Green challenge to its MPs in its inner urban Green Left seats. The miners don’t want to pay for them anymore.

To quote Labor’s great Finance Minister from the Hawke Government WA Senator Peter Walsh: if you base your policy on the demands of a minor party, you are destined to become one.


  • -
Shifting Demographic Tectonics - National Election 2019

SHIFTING DEMOGRAPHIC TECTONICS

Category:National 2019 Tags : 

Hi again, election tragics. We’re currently sifting through the statistical entrails of Saturday’s election, looking for key demographic characteristics of the ALP and Coalition votes and swings.

Peeling back the layers to find the underlying linkages between demographics and votes is time consuming and we’re also a bit busy working in the real world at the moment, running Education Geographics.

To keep you entertained, while we rummage around columns of stats, here’s a cute little Excel file which shows correlations going back to the election in 1966 for some key occupational indicators, male Tradies, female Clerks and Professional women.

Shifting Demographic Tectonics - Federal Election 2019

Female clerks and male Tradies have traditionally been huge groups in the workforce, and they still dominate our Working Family Stereotype across urban marginal seats, but the proportion of Working Families in the labour market has been steadily eroded over recent decades by technological change, now known as digital disruption.  Meanwhile, the workplace share of female Professionals is still growing fast and has already overtaken female Clerks, but these professionals are more clustered in the inner-cities and now dominate our Goat Cheese Circle Stereotype.

As Labor’s profile among Tradies declined during the 1980s, it increased among white collar working women, firstly among Clerks, then among Professionals, retaining a broad basis of support for Labor candidates across a majority of seats, while nudging it towards the inner cities, until Kevin Rudd’s Religious Activist profile in 2007  lifted Labor’s votes in the outer suburbs of our major capitals.

This professional support for Labor was lost in 2016, when Malcolm Turnbull led the Liberals, attracting inner urban professionals but at the expense of suburban Working Families. In 2019, under the folksy Scott Morrison as Liberal Leader, professional women turned back to Labor in droves, especially in Goat Cheese Circle seats. While this strategy held up Labor’s vote in higher SES seats,  it didn’t work out quite so well with Labor’s traditional Working Families, especially in LNP seats in Queensland.

To sum up: It’s always good for a Party to win a majority of the 2PP national vote, but it’s even better to win a majority of seats. In 2019, Scott Morrison won both by attracting support from marginal seats containing traditional Labor heartland voters and skipping the Goat Cheese Circle set.

As Morrison would say: How good is that?


  • -
The Religious Rudd and Grey Voters - their significance in the Federal Election 2019

THE RELIGIOUS RUDD AND THE GREY VOTERS

Category:National 2019 Tags : 

Hi there again, election tragics. Sorry I’m late with this short article but I had to ice the cupcakes for our school election day fundraising stall. No, seriously, I did. And I had to stop the five year old eating all the chocolate sprinkles. This is a quick note as I have to drop off the jellies, which have hopefully set. So apologies if there’s any errors in the comments on individual seats.

https://www.elaborate.net.au/Excel/Stereotypes 2019 (003).xlsx

The previous piece on Stereotypes and Voting drew a big response, so I decided to re-send the same Stereotypes Excel File, which you can download and play with, but with added columns for the Activist Religions which voted against type for Kevin Rudd in 2007, as well as Aged Pensioners and also our mean dollar figures for Superannuation Income in 2015/16.

I’ve been running into a few self-funded retirees this past week and it’s fair to conclude this group won’t be swinging to Labor anytime soon. I also think, given the strong evangelical profile of the Prime Minister Scott Morrison, compared to his predecessor Malcolm Turnbull, that this group will be moving towards the Coalition tonight. Remember here that it’s the swings that are important, not their absolute level of support for either party. A small swing from a big group located in marginal seats is campaign gold for party strategists. A big swing from a small group can also be valuable, if it’s also located in marginal seats.

The Activist Religions. This represented about ten percent of the vote in 2007 and does so again in 2019. In 2007 we took all those religions dominating the swings to Labor and selected the same groups again from the last census for 2019. Normally these religions are clustered in safer Coalition seats, but there’s huge numbers of them across Queensland seats, including quite a few marginals. Of the top 25 seats ranked for Activist Religions, 15 are in Queensland. Given the small national swings we’re seeing, for the reasons I outlined above, I would expect this group to be moving towards the Liberal Leader Scott Morrison. Among the seats which could be impacted by any such movement include Lingiari, Longman and Braddon (Labor), Dickson, Forde, Flynn, Capricornia and Petrie  (Liberal). Labor would thus be a little more vulnerable in three seats and have less chance of picking up five marginal Queensland seats. At the other end of the Activist scale, the seats tend to be stonking rich and full of Goat Cheese Circle types, such as Wentworth, the former seat of Liberal Prime Minister Malcolm Turnbull or inner city Green Left students and professionals, like Wills, the former seat of late Labor Prime Minister Bob Hawke. I served as a humble backbencher with Bob and I can still smell his Havana cigars up the corridors in the Old Parliament House. He will be missed.

The Religious Rudd and Grey Voters - Federal Election 2019

Aged Pensioners. We model this data every couple of years and these figures are probably a bit dated, but still relevant. I really don’t know how much the hostility to Labor’s policies on franking and capital gains tax are going to flow through to less asset rich persons who have retired on the Aged Pension. I suppose a little, but nowhere near as much as for those on their own super schemes. Still, if you select all columns on the Excel File and rank by Aged Pensioners, you can see some seriously big numbers in marginal seats, including Page, Robertson (Coalition), Richmond, Braddon, Lyons, Bass, Dobell  (Labor). These could be real momentum stoppers for a small pro-Labor national swing on election night.

Super Income. We extracted this ATO data and averaged it out over persons for our modelling of income generally. When we rank the federal seats for this figure, the ACT just jumps out as the top of the list, with figures in the thousands, with the next highest seats also looking to be representative of retired public servants. It fairly warms my heart to think we sold Telstra to set up a national Future Fund to achieve these figures. In reality, I’m probably just jealous I can’t put my own retirement savings into the Future Fund, because neither party has had the wit to allow us. When we consider the figures for the seats outside Canberra, we need to discount for the numbers of retired public servants on gold plated super schemes. This means you could probably rule out Eden-Monaro, marginal Labor with a lot of retired public servants. Coalition marginals which could benefit include Gilmore and Corangamite, although the latter is nominally Labor after the redistribution. The only marginal Labor seat which could be impacted is Herbert, although there would be a lot of Herbert retired military service voters on more secure super schemes.  That’s about it, really. The per capita Super figures really level right out after the top 20 or so seats. Which probably explains why the ALP adopted the policy it did.

The risk here for the ALP tonight is the extent to which all retirees feel targeted by changes to their retirement incomes generally. As far as the evangelicals go, these voters tend to be pretty quiet at election times and keep their opinions to themselves until they get to the ballot box. I suspect this might be a sleeper for some Queensland marginals.


  • -

STEREOTYPES AND VOTING

Category:National 2019 Tags : 

Hi there, election tragics. Here’s some data in Excel form for you to play with, in the lead up to election day and afterwards.

It’s in Excel form, so you can copy it, rank the seats, compare them with the vote and do your own sums with them on election night re the swings. We will try and do the same late next week, when the results are clear in close run seats.

https://www.elaborate.net.au/PDF/Stereotypes 2019.xlsx

The file shows the official ALP 2PP votes on current boundaries for all seats, plus our five most interesting stereotypes, based on 50 years of my own demographic research, including Labor’s demographic marketing campaign for the 1983 national election, which makes me very mature, indeed. I guess I’m the original tragic as far as demographic profiling is concerned.

As these are 2PP ALP votes, you can calculate the LNP 2PP vote by simply subtracting these figures from 100 percent for each seat, unless of course, it turns out to be won by an Independent.

Here’s a brief run down on the key stereotypes and their significance.

Stereotypes and Voting - Here’s a brief run down on the key stereotypes and their significance.

Working Families, are mainstream, average Aussie families, with skilled blue collar dad and a white collar mum, with an anxious eye on the family budget, flatlining real wages, transfer payments and tax cuts. Rank the excel file by this stereotype and you see a lot of them in marginal seats in Queensland and Western Australia. An awful lot. Too many to include here.

Goat Cheese Circle residents are inner city, very high income professionals. Lots of bike pants, Green votes, and senior public servants. They liked Malcolm Turnbull in 2016 but not Tony Abbott.  The votes of most of these are wasted in formerly safe Liberal seats, but some of these seats may swing to Independents  in NSW or Labor in Victoria.  A swing in 2019 against the liberals among this group would shore up my local member in Griffith and help Labor in Macnamara, the old Melbourne Ports. But not help Tony Abbott all that much.

Swinging Voters are made up of the demographics which consistently lead the swings either way at elections since 1966. Look for your local Nappy Valley, with lots of pre-school kids. Motivated by costs of housing, child care and part time jobs. These seats are strongly clustered in WA and any big swing amongst this demographic could turn very ugly for the Coalition, particularly very late on election night. I can still remember Mick Young late on 1969 election night, joking that the 1969 election would have been won for Labor, if there had been another state to the west of Western Australia. Conversely, the seats with fewer swinging voters which would be more likely stick to the Coalition are in Tasmania and National Party strongholds in the bush.

Coming of Age voters are young adults, often first time voters, moving away from parental political influences and starting out on life’s journey for themselves, with fewer visits to the Bank of Mum and Dad. There’s a few of these in marginal Coalition seats, like Brisbane, Chisholm, Swan and Reid and the one-time Labor seat of Ryan. There’s also some marginal Labor seats, like Griffith, Moreton, Hotham, Perth and Macnamara, but given the Newspoll swings in the relevant states, there’s not much joy there for the Coalition.

The Digitally Disrupted are working in blue collar and white collar jobs, currently among the first to be displaced by technology. There’s a big overlap with Working Families, which explains their anxieties at the moment. Typically these jobs are frozen in terms of numbers and then wither as a percentage of the workforce. In terms of seats, this is pretty safe territory for the Labor Opposition, but there are some marginals for the LNP in Queensland in Flynn and Forde. There’s also some marginals for Labor in Lindsay, Braddon and Lyons and if swings in NSW and Tasmania go the Coalition’s way, these would be vulnerable.

We’ve already posted some scatterplots using these stereotypes, showing how Goat Cheese Circle voters influenced the Green Primary vote in 2016 and how the Working Families group dominated those seats swinging to Labor. The full picture can be seen on our 2016 Dashboard under Demographic Profiles, Family Types, Voter Indices. https://www.elaborate.net.au/ADSElect2016%20PostVote.htm

It shows, subject to ecological fallacies of course, seats swinging to Labor in 2016 dominated by Working Families and the Digitally Disrupted and swings to the Coalition dominated by Goat Cheese Circle voters who liked Malcolm Turnbull.


  • -
Longman By-Election - 2018 Qld

LONGMAN BY-ELECTION 2018

Category:By-Elections,National 2019 Tags : 

The ADS team has prepared an exhaustive profile of by-election swings in Bennelong, New England, Longman and Mayo.

A full report of the swings and their implications for the 2019 election appears in the Weekend Australian.

Below is a link to the maps of the swings and the associated demographic drivers for Longman.

Click away and compare the swings to and from the major parties with key demographics in our statistical profile.

Click on the Map to view

Longman By-Election - 2018 Qld


  • -
Malcolm Turnbull campaigns in Caboolture, in the Queensland seat of Longman

DIVINING VOTES ALL ABOUT SWINGS AND ROUNDABOUTS AT BY-ELECTIONS

Category:By-Elections,National 2019 Tags : 

Provided your humble correspondent is not eaten by a grizzly bear next week while trout-hunting in the wilds of northwest Canada, he will be back in time to help our team sift through the demographics of Super Saturday.

We will be looking for demographically driven swings across the booths in Longman and Braddon that are consistent with the swings we saw in New Eng­land and Bennelong; and tangible links between these patterns of swing and the policy offerings of the government and the opposition, especially as they relate to the hip-pocket nerve.

I’m looking particularly at swings by voters concerned with imputation tax increases for retirees and ­income tax increases for aspirational voters.

If we can see patterns among bigger demographic groups living in marginal seats then we can draw some inferences as to their impact at the next federal election. The other seats will provide a bit of a sideshow to the main event in Longman and Braddon.

South Australia’s Mayo, for ­example, is a seat a popular, local Liberal should have won back easily from former Nick Xenophon protege Rebekha Sharkie, who won Mayo from the less-than-popular local Liberal MP Jamie Briggs. However, polls show about 60 per cent of Mayo’s new generation of prosperous and professional commuters support Sharkie over the Downer dynasty’s Georgina Downer. After generations of political mulishness that has splintered the ­Coalition vote in South Australia — dating back to the original Liberal Movement — the Adelaide political establishment, like the old French aristocracy, learns nothing and forgets nothing.

The two West Australian by-elections of Fremantle and Perth will be interesting as a guide to how many intending Liberal voters, when denied a candidate, will vote for Labor over the Greens. Way too many to cancel the loss of Mayo, would be my guess.

Let’s look at what we know.

Last year’s by-elections in New England and Bennelong showed an average swing to the government of 1 per cent and a range of swings across the booths of about 12 per cent. The biggest swings against the government were in urban Bennelong booths dominated by progressive Left Sydney voters who hated having to vote yes in the same-sex marriage plebiscite and by conservatives who hated losing.

However, urban middle-class mainstream voters could not see what the fuss was about and quietly saved Liberal John Alexander.

In New England, Nationals flag-bearer Barnaby Joyce had his vote boosted by the big group of Howard battlers who had drifted back to Labor since 2007. We’re talking here about welfare recipients, tradies and hospitality workers living in rented accom­­mo­­­­dation in country towns where they can find affordable housing.

Battlers are also pretty thick on the ground in Longman in Queensland, a state where, in 2004, about one in seven electors voted for Labor premier Peter Beattie at the state election and then for Coalition prime minister John Howard eight months later at the federal election. This splitting of votes at state and federal elections is a characteristic of the Howard battler, a demographic that can be sentimentally supportive of favourite leaders but ruthless towards parties they regard as taking them for granted — especially with their Senate votes.

The trick for politicians is to match the sentimental rhetoric with what these voters see as their economic self-interest.

In Longman, they voted for Beattie because they saw themselves as Labor supporters and they voted for Howard because he stopped the boats, looked after their pensions and made the economy run on time. They had no problem holding what many commentators would regard as contradictory positions.

Plenty of Howard battlers are found in Braddon, where one in seven locals split their primary vote in the last state and federal elections. In mid-2016 the federal primary Liberal vote was 41.5 per cent for MP Brett Whiteley, but the primary vote for state Liberal candidates in March this year was 56.1 per cent.

In Longman and Braddon, polls are showing an average swing towards the Coalition of about 2 per cent, meaning both seats could go either way next Saturday. This is broadly consistent with the 1 per cent average swing to the government in New Eng­land and Bennelong, perhaps even a slight improvement for the Coalition.

Given some of the economic difficulties facing the federal government, compounded by its gaffes, even a small swing to the Coalition on its 2016 figures in these two seats would be exceptional, especially considering that Labor’s new MPs in Long­man and Braddon would have seen their vote rise by a couple of per cent since 2016 because of the personal vote benefits of ­incumbency.

Any opposition should comfortably win by-elections in seats it already holds. It should come close to winning more marginal seats like Bennelong.

Hopefully the demographic range of swings across the booths in Braddon and Longman will shed some light on why the opposition is underperforming and tell us what this could mean at the federal election due before the middle of May next year.

I’ll be paying particular attention to the range of swings across booths dominated by the different income groups to see which tax policies look like winning the most votes — with the opposition favouring those earning below $90,000 a year and the Coalition favouring those earning above that amount, particularly up to $200,000.

Like my Canadian trout taking a breather in a deep pool on their upstream spawning run, taxpayers tend to concentrate in income tax ranges just below a big jump in their marginal tax rate, so we’ll check the reaction from working voters who aspire to earn more.

We will see if we can discern any impact from the reductions in dividend imputation for retirees, although this one could be messy in practice.

With this sort of research, we go where the evidence leads us and we could see, for example, some impact from the campaign run by Catholic education against some of the federal funding ­reforms, which would be easy enough to measure given the ­detail in our education database.

We may see some increased support for the government’s quiet cuts in immigration, which would show as an increased vote for the Coalition among the huge mainstream groups of English-speaking and Australian-born. It’s pretty hard to lose an Australian election when you’re getting a swing towards you from Australian-born voters.

My working hypothesis is that Labor is making gains among younger, professional voters, ­especially those benefiting from the opposition’s big spending promises on new jobs in health and education.

We find these voters in the high-priced houses of the inner cities, the city seaside suburbs or bigger blocks with a view in the outer suburbs. But the Liberals should be able to withstand this sort of movement in what are typically their more comfortable urban seats, unless they repeat the mistakes of Mayo.

Labor is also making gains in Sydney and Melbourne among some conservative, non-English speaking migrant groups living in safe Labor seats, who respond well to big-spending promises as they are direct beneficiaries. However, these gains in votes by Labor often don’t bring commensurate gains in seats.

The Coalition seems to be still going well among middle-class, Australian-born families in mainstream urban areas and among Howard battlers in the middle to outer suburbs and in some pro­vincial city-rural seats. This is not the picture of a comfortable Labor majority, either in votes or in seats.

Roll on, Super Saturday, and I’ll report back if the bears don’t get me first.


  • -
New England and Bennelong By Elections in NSW

NEW ENGLAND AND BENNELONG BY-ELECTIONS

Category:By-Elections,National 2019,NSW Tags : 

See for yourself in our Esri online map how local demographics fed into the results in New England and Bennelong by-elections and the Same Sex Marriage plebiscite.

Click on the link to the map below. It will open with a default map of the Bennelong estimated 2PP swing to the Liberals, with the dark blue streets swinging slightly to the Liberals and the lighter areas swinging strongly to Labor. Now click on the Layer icon  at top right of your screen to open the Layer list. You can see the legend in the map by clicking on the small arrow to the left of the layer called Bennelong Liberal-Swing . You can click on the layer Bennelong Polling Booths  to show each booth and click on the booth icon itself to see the results.

Save this map of the swing by taking a screen snip or leave it open in another screen and then click off the swing and open the other Bennelong layers. You can open more than one at a time and see the impact of the various demographics on the swing. So you can open Layers for creative arts, Green votes and Agnostics, to see the combined impact of all three. This isn’t rigorous statistical modelling, but it gives you an idea of how it works.

The strongest predictor of the swing was not the Bennelong Chinese born males (or females), but Bennelong Males with No Religion. These Agnostics at the National level were the strongest supporters of the Yes vote in the Same Sex Marriage Plebiscite and when we fed this variable into the modelling, ethnicity did not contribute any additional explaining power. Chinese born persons in Bennelong tend to be Agnostics, but it was their lack of religion, rather than their ethnicity which tended to accompany the biggest political swings to Labor in Bennelong.  This shows us we should look past obvious ethnic stereotypes if we’re trying to explain voting behaviour.

When you have finished with Bennelong, you can click on the Bookmark icon  at top left and select New England which opens a default map showing the estimated 2PP swing to the Nationals, with the darker green areas registering the largest pro-National swing. Once again, save a copy of this map and compare it to those larger local demographics most strongly linked to the by-election swing to the Nationals: 2016 ALP voters, Tradies, or those demographics dominating the booths with smallest by-election swings to the Nationals: in this case men working in the Agricultural industry.  We reversed the direction of the legend in this last one so the areas with the darker green colouring contain the fewest farmers and farm workers and the biggest pro-National swings. This confirms that the smallest swings to a party often occur in the areas of strongest support for the same party.

Click on the map or link below to view.

New England and Bennelong By-Elections - See for yourself in our Esri online map how local demographics fed into the results in New England and Bennelong by-elections and the Same Sex Marriage plebiscite. See for yourself in our Esri online map how the local demographics fed into the results in New England and Bennelong.

https://egs-au.maps.arcgis.com/apps/webappviewer/index.html?id=cd901e880d5e44aabcae6a86cd8b0edd


  • -
Australian Labour Force May 2017

TRADIES UP, BUT CLERKS & SALES JOBS DISAPPEAR

Category:Labour Market,Labour Market 2016,Labour Market 2017,National 2019 Tags : 

The national Year on Year employment to population ratio and the participation rate stopped their downward slide during the February labour market quarter and during the May quarter both were moving in a positive direction.

If we smooth the original data out to a 12-month moving average we see the start of what looks like an upward turning point in the employment trends to the end of May and the national figures for June and July were reasonably encouraging.

But a detailed examination of the figures by industry and occupation infer some caution should be exercised.

Industry and Occupational Breakdown of National Data.

By industry, over the past year, agriculture continued what looks like a long term structural decline in jobs, manufacturing showed some signs of life, but construction was still in good shape, as was hospitality.

IT and Media had some short-term gains, but the only consistently strong private sector industry remained Professional Services, (such as lawyers, architects, engineers, accountants) with nearly 63,000 jobs created over the past year and 300,000 jobs in the decade since the GFC.

The predominantly public sector funded or regulated industries of Public Admin, Education and Health remained the biggest drivers of jobs growth, with 45 percent of all jobs created over the past 12 months and 50 percent over the past decade.

When we look at the ABS labour market table showing the narrowly defined version of public sector vs private sector for Occupations, rather than by Industry, we see 41 percent of jobs by occupation last year were created directly by the three differing levels of Government in the public sector, instead of the long-run figure of about 12.5 percent.

In the private sector, 138,400 jobs were created and 74,500 were professionals, but private sector managers (and farmers) went backwards by 13,100 jobs. The hollowing out of female middle-class occupations by digital disruption continued, with 41,800 clerical and receptionist jobs going, virtually all of them full time, even as 42,200 sales jobs also disappeared.

The positive figures in the private sector side of the occupation table came from the creation last year of 76,600 full-time jobs for Tradies and Technicians. There were also an extra 91,200 mostly full-time jobs for the semi-skilled and unskilled blue-collar workers (machine operators, drivers, labourers and cleaners). However, the bulk of these jobs were low paid and those that weren’t, such as Tradies, were coming off a very low base in mid-2016, keeping wages low.

So where were these middle class white collar jobs lost and where were the blue-collar jobs gained?

Regional Variations.

The earlier post-GFC map link and the latest map link are shown here.

https://educationgeo.maps.arcgis.com/apps/webappviewer/index.html?id=de5ec5b142644631976efa3b384f6948

Australia Labour-Force-2008-2016

https://educationgeo.maps.arcgis.com/apps/webappviewer/index.html?id=0a950e5ff5bc4ff2adff2c76baac084a

Australia Labour-Force-May-17

The online maps show the more recent national recovery in blue collar jobs seems to have also driven up employment levels and participation rates in many mixed working class and agricultural regions on the fringes of our major cities, like La Trobe – Gippsland in Victoria and Logan – Beaudesert in Queensland.

In New South Wales, the formerly hard hit and relatively low SES remote and rural regions like Murray, and Far West and Orana have shown a post GFC recovery and a bounce-back of jobs under threat from technology which is supported by both the national summary data and the regional data.

Well outside the capital cities, we saw a strong local recovery in the jobs market include many working-class economies which had been doing it tough in the eight years since the GFC and these include Townsville – which is genuinely heartening to see – along with other Queensland regions like Toowoomba, Ipswich, Cairns and Mackay. So, we’re seeing some growth, but from historically very low base levels.

When it comes to job losses, it’s a little surprising that some of the richer inner-city regions of Sydney, Brisbane and Perth were shedding jobs in the 12 months to May 2017.

Demographic Profiles.

After running these figures through our database for some simple correlations, we saw that the (lower SES) regions which gained the most jobs in the 12 months to May 2017 were those containing lower income, young parents, with few educational qualifications and little vocational training and living in what seemed to be often overcrowded, State rental housing, with younger children.

We saw a mix of the more evangelical religions, like Seventh Day Adventist and Other Protestant, which we note often in the urban fringe seats of south east Queensland, along with Aboriginal Traditional Religions and Languages from regions like the NT Outback and Far West NSW.

Those regions heading backwards during the last year were older, specifically aged from 55 years and above. They were also reasonably well off. Their residents tended to be retired, relying on superannuation and Government pensions for income.

Mortgage stress made a showing here and this could be a pointer to middle class persons in their late fifties, transitioning to retirement and building up super balances to discharge their mortgage only when old enough to receive the aged pension.

Finally, we should note that, while there were only small drops in the national summary figures for women in full time real estate jobs, those regions across Australia with the greatest proportion of real estate agents were shedding jobs over the past year and it was statistically significant to 99.9 percent confidence levels.

The bounce back from blue collar jobs during the past year is a welcome sign of some recovery in the private sector, but strong bias towards public-sector jobs growth over the last 12 months infers that the apparent healthy recovery in the national labour market figures may not be sustained.