2015 – Qld State Election Report
Category:Election Profiles,Maps - Elections,QLD,Qld Election 2015A week after the election on January 31, it is still unclear which of the two major parties will form a Government. The most likely outcome is a minority Labor Government supported by Independent Peter Wellington.
Labor candidates won an estimated 50.9 percent of the two party preferred (2PP) vote, but Labor appears likely to win only 44 out of the 89 seats. On the same state boundaries in 2009, Labor Premier Anna Bligh won a comfortable majority of 51 seats with 50 percent of the 2PP vote.
This failure in 2015 to translate a majority of the 2PP Labor vote into a majority of seats came about because Labor failed to win middle class and professional voters in aspirational marginal seats on the Gold Coast and in Brisbane.
The major driver of the swing against the LNP appears to have been the current high net dissatisfaction levels of LNP Leader Campbell Newman and Federal Coalition Leader Tony Abbott.
Campbell Newman’s personal vote in his own seat of Ashgrove was minus 5.5 percent and this is consistent with the impact of a net dissatisfaction rating of minus 23 percent, which was recorded by Newspoll on January 29.
Read Full Report – Qld State Election Report 2015.
Download spreadsheet showing :
Qld State Performance, Qld State Trends, Aust. State Predictions and Federal Seat Predictions.
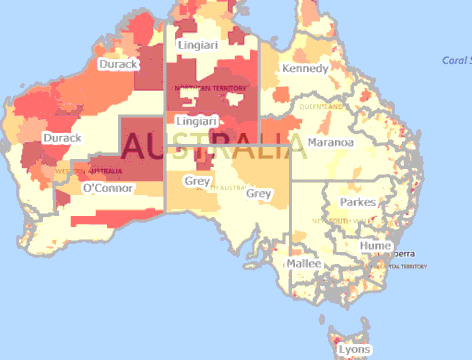
Map showing predicted alp 2pp vote by neighbourhood (sa1) based on the Qld State Election.
The map shows the Predicted ALP 2PP Vote by SA1 based on the QLD state election with the Federal electorates overlaid. You can search for an electorate and get the results for the electorate. There is also a separate layer available showing the 2pp swing to the ALP in QLD state electorates as per the original map.